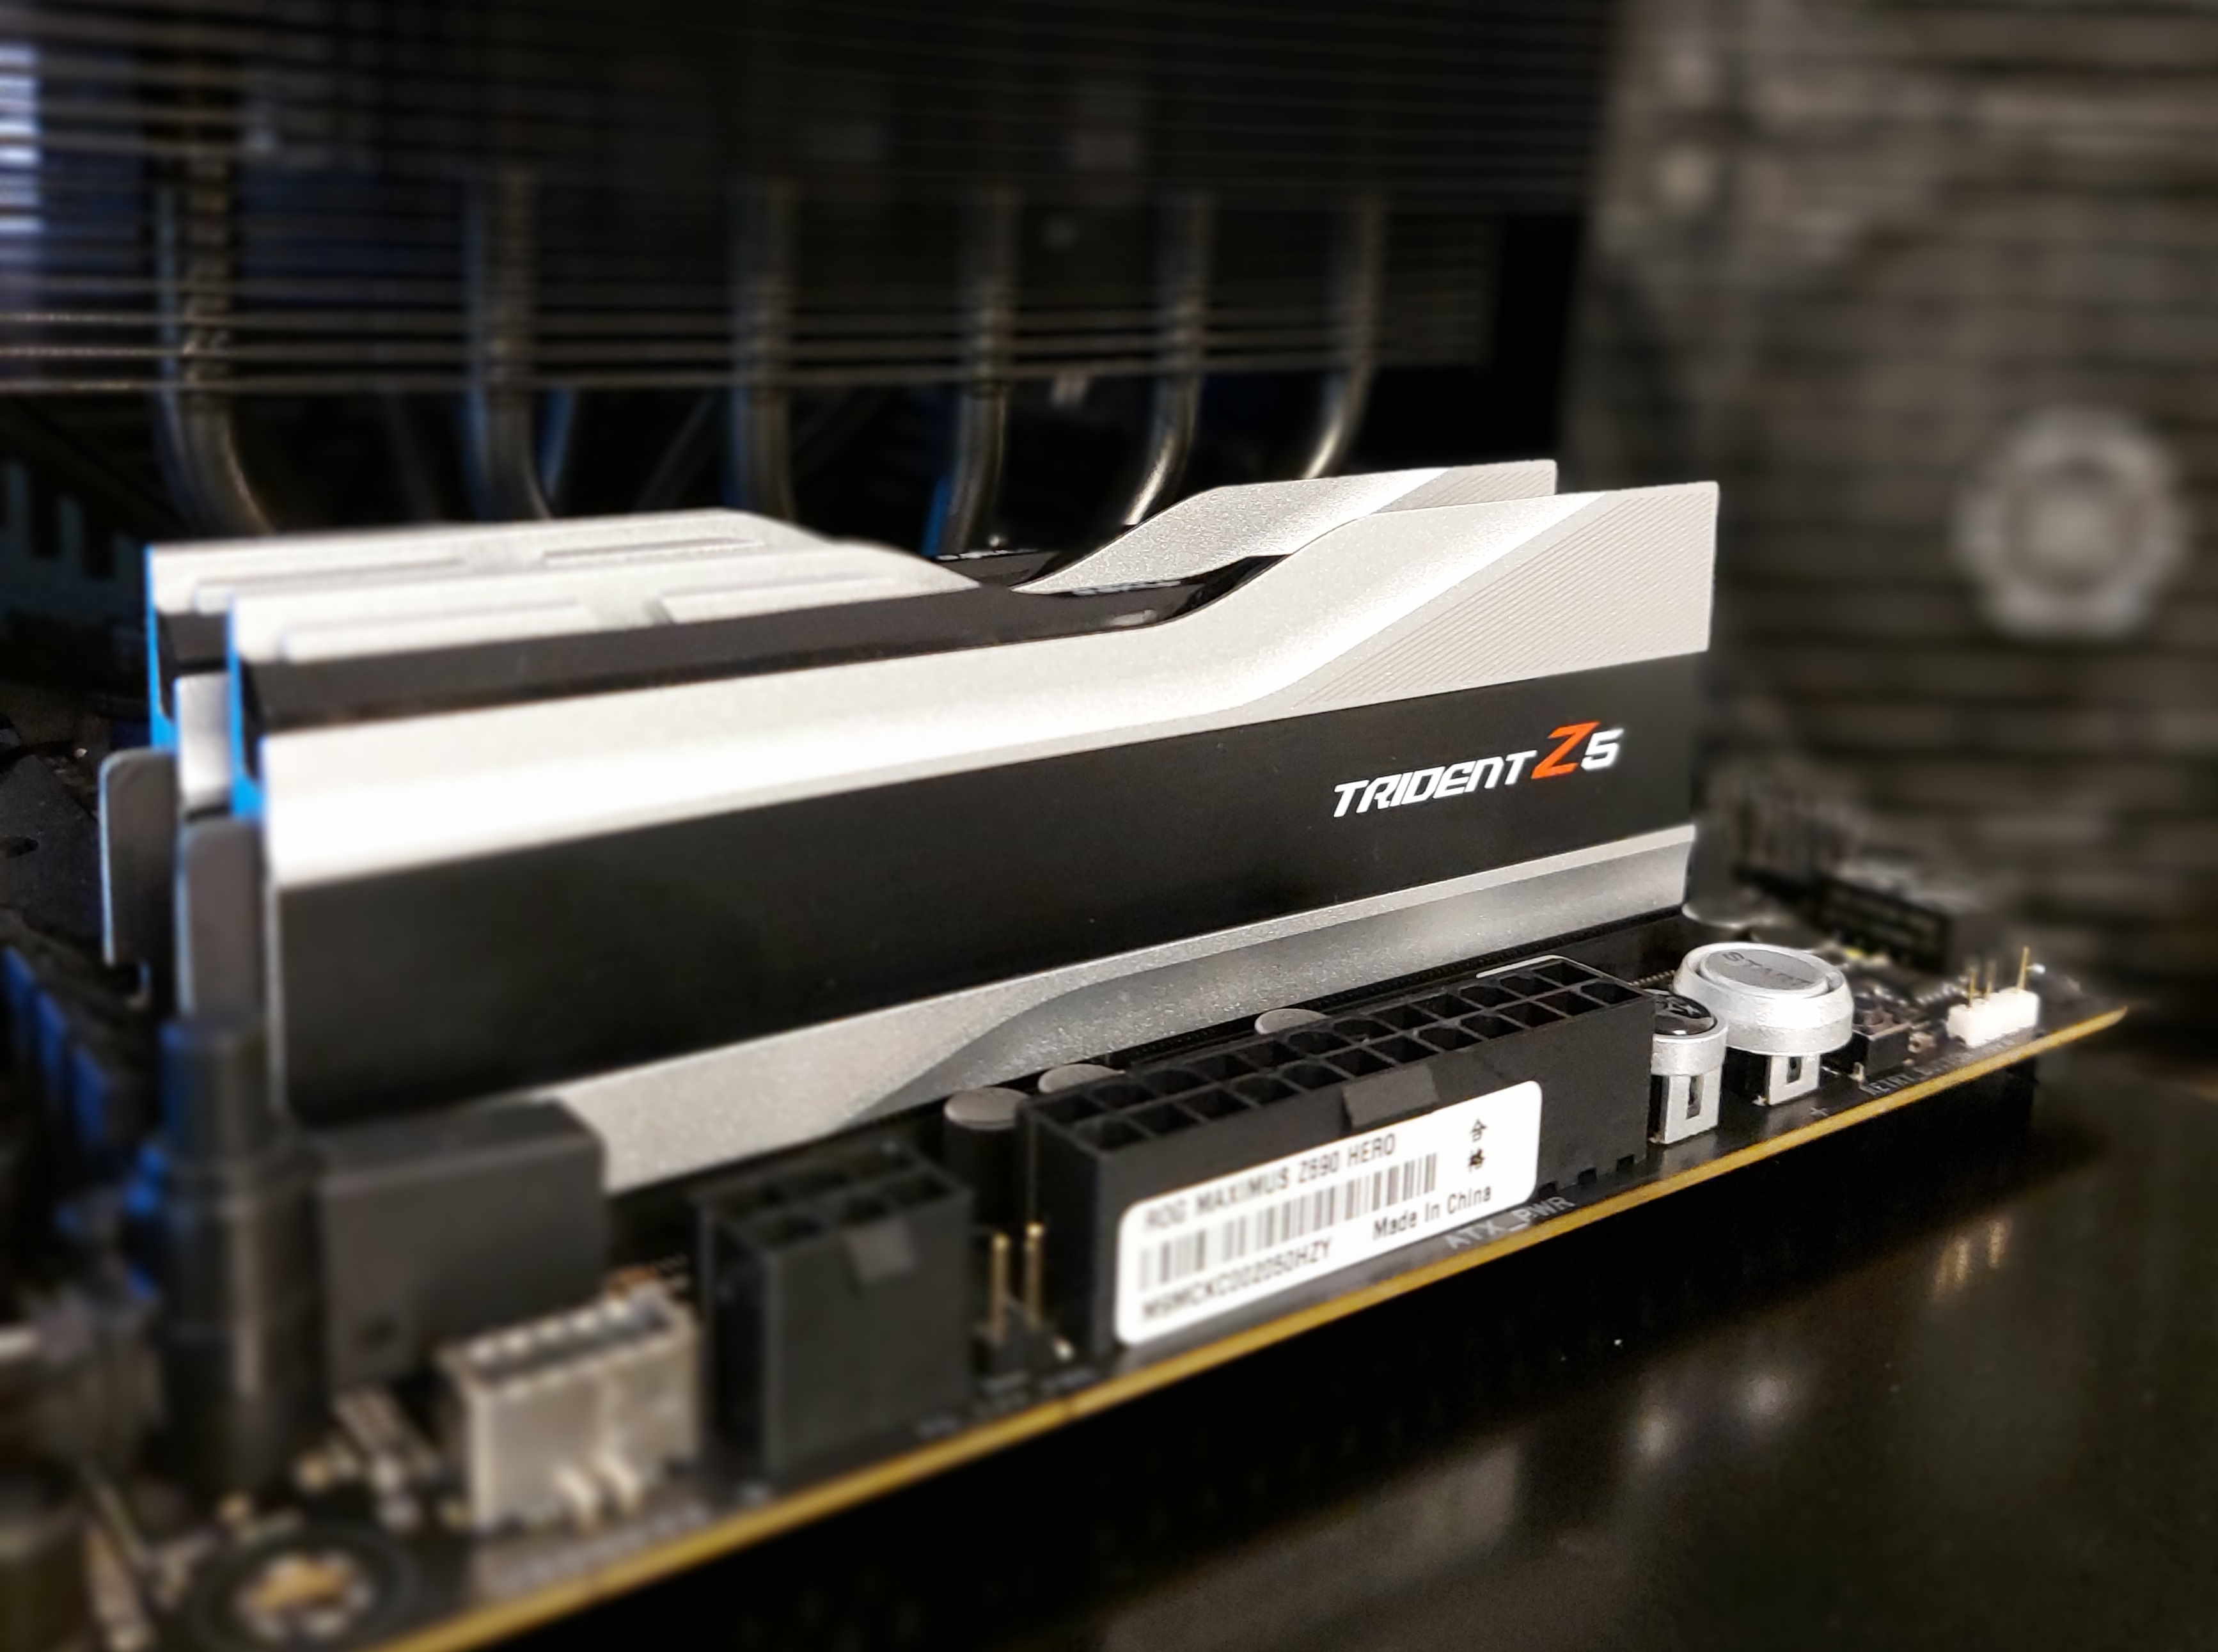
But what happens if you use significantly faster memory? Do Z690 systems run stable with it and does the gaming performance benefit as well? We'll take a closer look at that in the following test. Overclocked Trident Z5 DDR5-6000MHz C40 from G.Skill was used.

Methodology
Frametimes were captured with CapFrameX in version v1.6.6, which implements telemetry support and Performance/Efficient Core detection for Alder Lake.
Configuration of CX
- Overlay refresh rate 1000ms
- Auto-disable OSD active
- Run History and Aggregation enabled
- Outlier tolerance 3%
- 3 valid runs with a duration of 20 seconds = 1 valid session
- Sensor logging enabled with a refresh rate of 500ms
- Default configuration of sensor logging for standard benchmarks
Game settings
- Resolutions: 720p
- Render scaling reduction if needed
- Reduced AA/AF/AO to a minimum
- Post Processing disabled
- All other settings maximized to maximize draw calls
Overall, demanding custom scenes were used to maximize stress on CPUs and memory.
Metrics
- Average FPS
- 1% percentile, which is not sensitive to reproducible and especially random outliers.
Test Systems
An open test bench without further active cooling was used for the gaming benchmarks. The board was mounted horizontally on the test bench. A be quiet! Dark Power Pro 650 watt power supply provided the components with power. The CPUs were cooled with the Noctua NH-D15 chromax.black. The graphics output was handled by a PowerColor Red Devil Limited Edition Radeon RX 6800 XT (2500/2100MHz) and an ASUS ROG Strix RTX 3070 Ti (2100/1188MHz).
The stability of the RAM OC was carried out with Karhu RAM Test. The condition for stability was a 10k% test coverage.
5900X OC
CPU: AMD Ryzen 9 5900X Curve Optimizer 50MHz Offset
RAM: G.Skill 2x16 3733MT/s CL14-15-14-28 1T Gear Down Mode enabled
Mainbard: Gigabyte X570 AORUS MASTER
12900K OC DDR4
CPU: Intel Core i9-12900K 5.1GHz P Cores
RAM: G.Skill 2x16 4000MT/s CL16-16-16-32 2T
Mainbard: ASUS ROG STRIX Z690-A GAMING WIFI D4
12900K OC DDR5
CPU: Intel Core i9-12900K 5.1GHz P Cores
RAM: G.Skill 2x16 6200MT/s CL38-38-38-74 2T
Mainbard: ASUS ROG MAXIMUS Z690 HERO
Benchmark Suite
The used game benchmark suite includes a total of 10 games. The majority of the games are selected in such a way that the CPUs are heavily stressed. The achieved frame rates are partly significantly below what modern monitors can display. Exceptionally, 2 titles with integrated benchmarks (built-in) are also used this time to cover heavily cache-heavy scenarios. What might seem surprising is the use of ray tracing for CPU tests. However, considering that ray tracing puts additional load on the CPU due to the lack of culling and an increased number of draw calls due to objects outside the invisible screen space makes the decision understandable.
- Cyberpunk 2077 (Raytracing)
- Crysis Remastered (Raytracing)
- Shadow of the Tomb Raider
- Hitman 3
- Star Wars Jedi: Fallen Order
- The Ascent (Raytracing)
- Fary Cry 6 (Raytracing)
- Metro Exodus Enhanced Edition (Raytracing)
- The Division 2 (Built-in)
- Rainbow Six Siege (Built-in)
Results 720p with OC
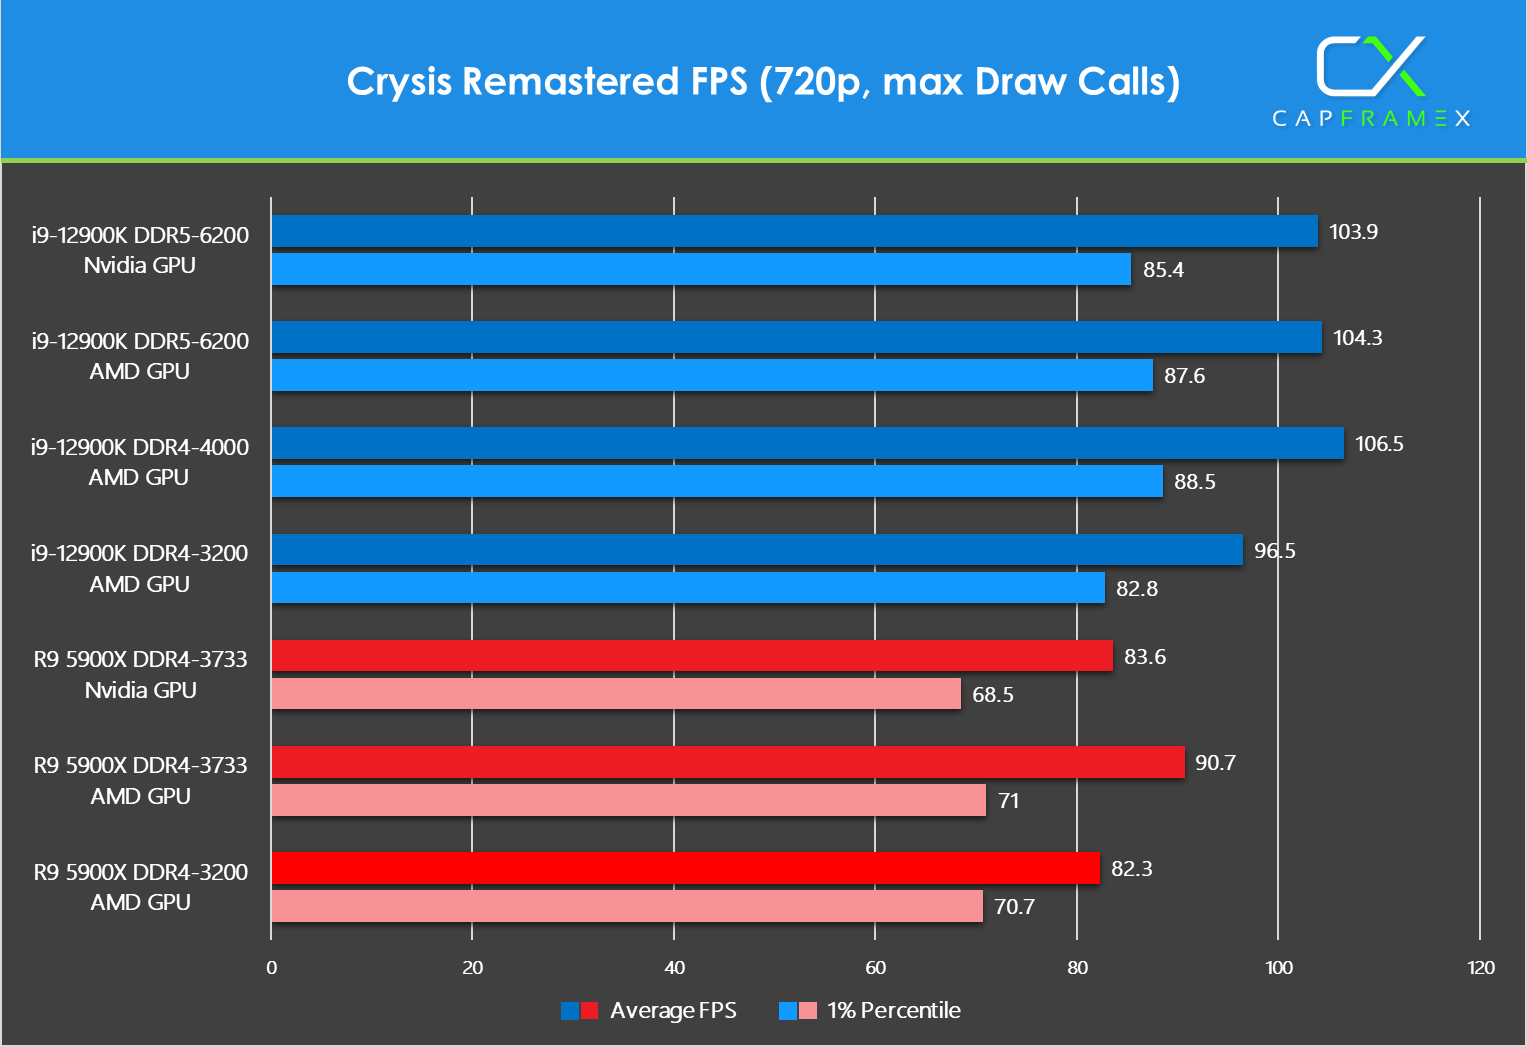
Crysis Remastered
- API: DirectX 11
- Engine: CryENGINE 5.6
- Special aspects: Detail level increases automatically with increasing resolution
- Scene and Settings: Video

Cyberpunk 2077
- API: DirectX 12
- Engine: RED Engine 4
- Special aspects: Streaming-heavy scene
- Scene and Settings: Video

Far Cry 6
- API: DirectX 12
- Engine: Dunia 2 Engine
- Special aspects: Very single-thread bound
- Scene and Settings: Video

Hitman 3
- API: DirectX 12
- Engine: Glacier Engine
- Scene and Settings: Video

Metro Exodus Enhanced Edition
- API: DirectX 12
- Engine: 4A Engine
- Scene and Settings: Video

Rainbow Six Siege
- API: Vulkan
- Engine: AnvilNext 2.0
- Special aspects: Very cache-heavy
- Scene and Settings: Video

Shadow of the Tomb Raider
- API: DirectX 12
- Engine: Foundation Engine
- Scene and Settings: Video

Star Wars Jedi: Fallen Order
- API: DirectX 11
- Engine: Unreal Engine 4
- Special aspects: Very single-thread bound together with Radeon driver
- Scene and Settings: Video

The Ascent
- API: DirectX 12
- Engine: Unreal Engine 4
- Scene and Settings: Video

The Division 2
- API: DirectX 12
- Engine: Snowdrop Engine
- Scene and Settings: Video

Package Power Games 720p (Update 11/30/21)
CapFrameX was configured to record the package power (W) of each CPU during the gaming benchmarks. The following table shows the average package power per session at 720p.
| Average Package Power [W] |
R9 5900X DDR4-3200 AMD GPU |
R9 5900X DDR4-3733 AMD GPU |
R9 5900X DDR4-3733 Nvidia GPU |
i9-12900K DDR4-3200 AMD GPU |
i9-12900K DDR4-4000 AMD GPU |
i9-12900K DDR5-6200 AMD GPU |
i9-12900K DDR5-6200 Nvidia GPU |
|---|---|---|---|---|---|---|---|
| Crysis Remastered | 96 | 106 | 101 | 92 | 99 |
98 | 92 |
| Cyberpunk 2077 | 112 | 126 | 122 | 130 | 142 |
143 | 148 |
| Fary Cry 6 | 96 | 105 | 102 | 85 | 99 | 101 | 98 |
| Hitman 3 | 97 | 108 | 108 | 95 | 102 | 108 | 110 |
| Metro Exodus EE | 97 | 110 | 102 | 94 | 101 | 107 | 102 |
| Rainbow Six Siege | 106 | 118 | 114 | 93 | 111 | 110 | 113 |
| Shadow of the Tomb Raider | 110 | 126 | 122 | 103 | 137 | 142 | 142 |
| Star Wars Jedi: Fallen Order | 92 | 104 | 99 | 75 | 93 |
92 | 90 |
| The Ascent | 100 | 113 | 106 | 96 | 108 | 111 | 107 |
| The Division 2 | 109 | 118 | 115 | 100 | 102 | 117 | 119 |
Conclusion
On average, the DDR5 system is slightly ahead but the DDR4 results are also respectable. Unfortunately, the IMC did not enable higher clock rates. However, there are already examples on the Internet with a transfer rate of 4233MT/s and Gear 1 mode but this should be the exception rather than the rule.
The lead over the Ryzen 5000 is so serious that even future models with 3D V-cache will probably not reach this high performance level. AMD's current generation is clearly outclassed (OC vs OC) and DDR5 with transfer rates beyond 7000MT/s are yet to come. However, Zen 4 will presumably already be available then and will also benefit from fast DDR5.
