For the past three months we were very busy adding loads of new features to our software.
Today we can finally present you version 1.5.0, which is now available in the download section aswell as on github.
There are many new features and also some other changes so in this news we'll show you all the important additions and changes.
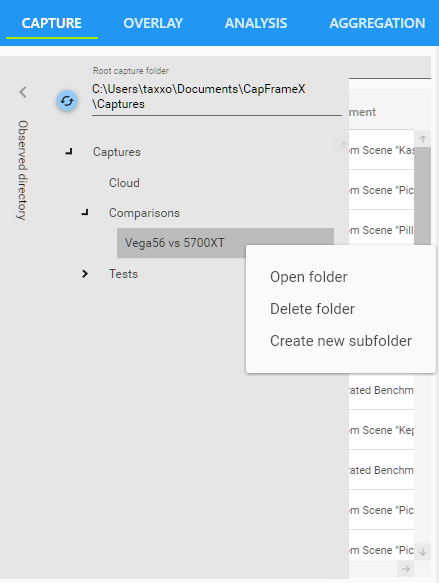
New folder management
This feature was added to improve the handling of different record folders.
Instead of constantly having to go through the global options menu to change the capture folder, we now have an expander right beside the record list.
You can set a root folder by clicking on the address line on top and a tree view will show you all subfolders within that root folder.
Adding new subfolders, deleting existing folders and open folders in explorer can now also be done with a right click on any folder.
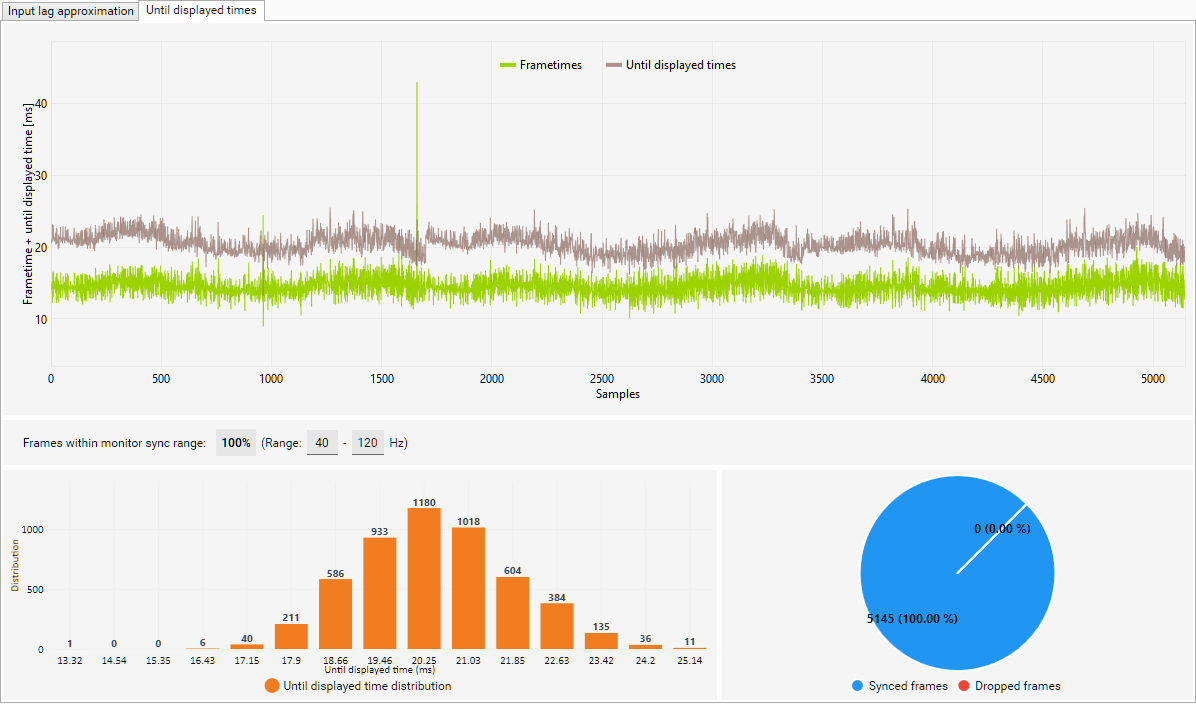
Overhaul of "Synchronization" page
We removed the "display changed times" graphs because it turned out that you can't reliably make an assertion on the state of Sync Methods(FreeSync, G-Sync, V-Sync) based on that parameter.
But we wanted to keep the tab because the other information on that tab is still relevant, so we added the "until displayed" values instead.
These values show you the time it took for each frame to be shown on your monitor.
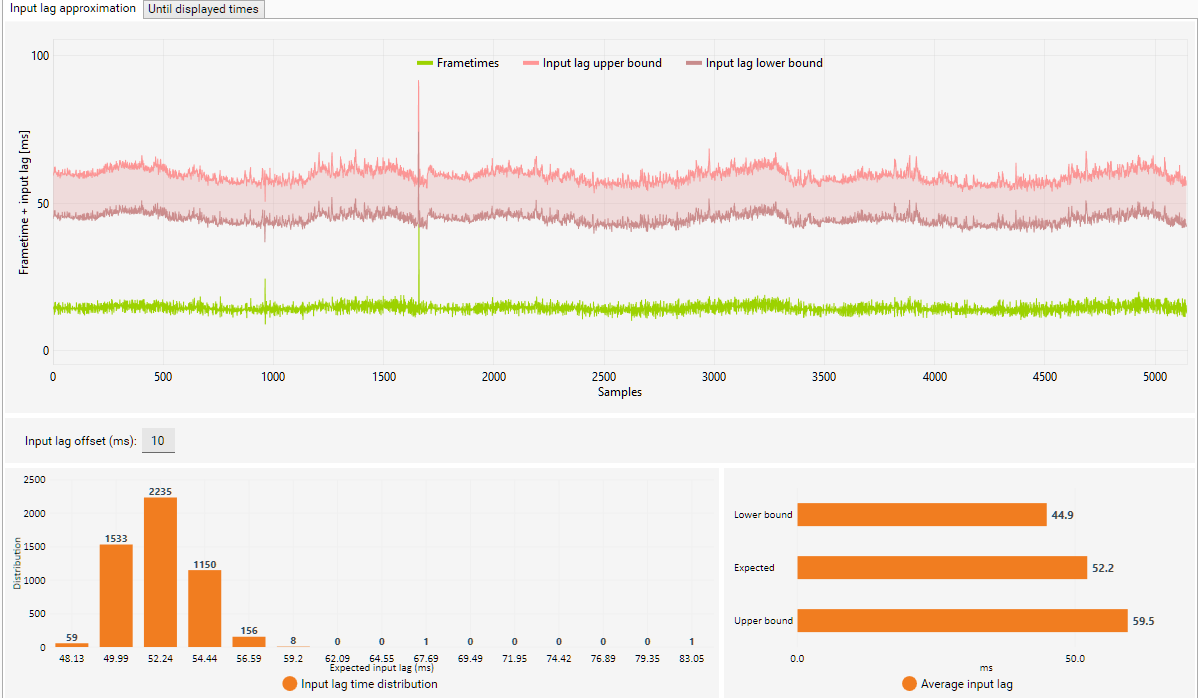
We also changed the way the input lag gets calculated. Especially when using FPS limiters the old values can be more or less accurate depending on the way the limiter works.
So we calculated the theoretical maximum input lag and the theoretical minimum input lag, with the expected input lag being the average of the two.
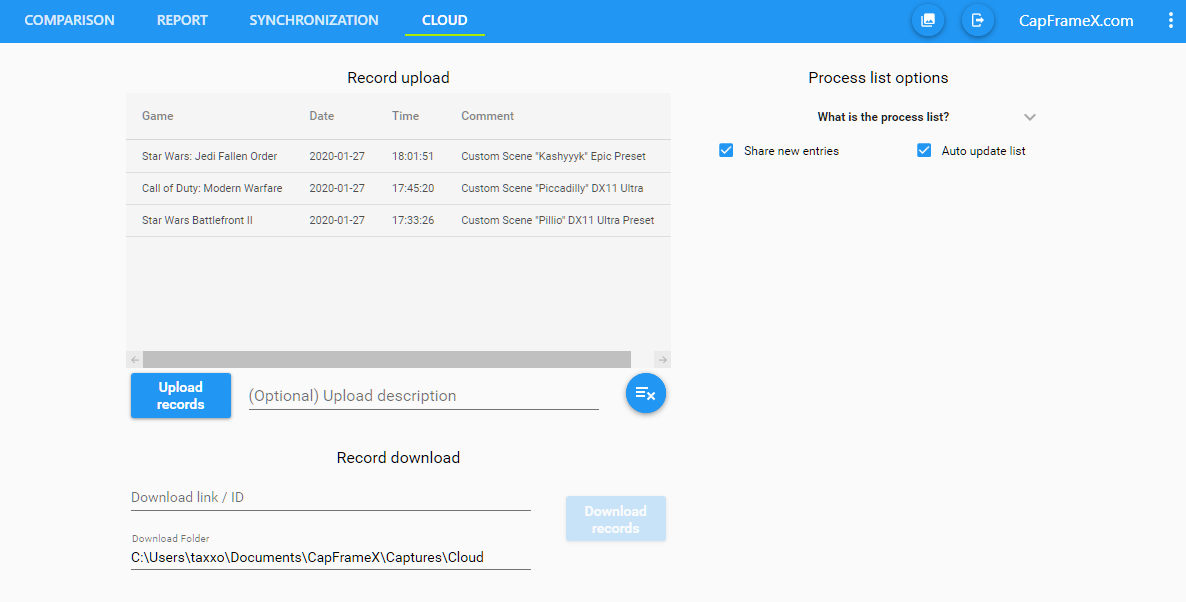
New "Cloud" page
This page includes two main functions. The first is to share records and download records from others, the second is to automatically share and update your process list.
Sharing records is done by adding them to the upload list and clicking the upload button. You then get an ID that you can share with others.
If you got an ID from someone you can paste it in the download section to download all the files contained in that session.
You can also view and manage your uploads and IDs on our website if you log in on CX before uploading records. The login button is located at the right side of the navigation bar next to our website link.
You can then use the same account to log in on our website and view your uploads from the user menu.
To easily distinguish your uploads from another you can add an optional description on the Cloud page before uploading them.
For the two process list options, it would be best to first explain what that list does.
Before, we used one textfile containing the game names you've set for your processes and one textfile containing the processes you've put on ignore on the capture page.
We included default lists in every new CX version that got compared to your lists on every start and any processes that was not on your own list was added.
This becomes a problem if a user wants to capture something that is on our default ignore list because with every restart of CX the process gets back on his ignore list.
Therefor we replaced both of these textfiles with a single json file that includes all processes and holds information about their process name, the displayed name(Game name) and if the process is ignored.
With that we can add any process to our default list without changing entries in your own list because we only add processes missing from your list, so the game name and ignored status you've set won't be overwritten.
Now to the explanation of the two options.
"Share new entries" is an option we'd like to ask everyone to use.
With this option checked, anytime you add something to your process list, whether it be a game name for a process that didn't have one yet or a new process you put on ignore on the capture page, that process will be sent to our server so that we can add it to our default list.
"Auto update list" is an option you can use if you don't want to wait for a new release to get the latest default list.
With this option checked, on every start CX checks the current default list on our server and adds new entries to your list.
New sensor logging
Using openhardwaremonitor libraries, we added various sensor options to the overlay page. The sensors you see are depending on your own hardware so there's nothing in that list that you couldn't use.
You can save three profiles for different overlay configurations.
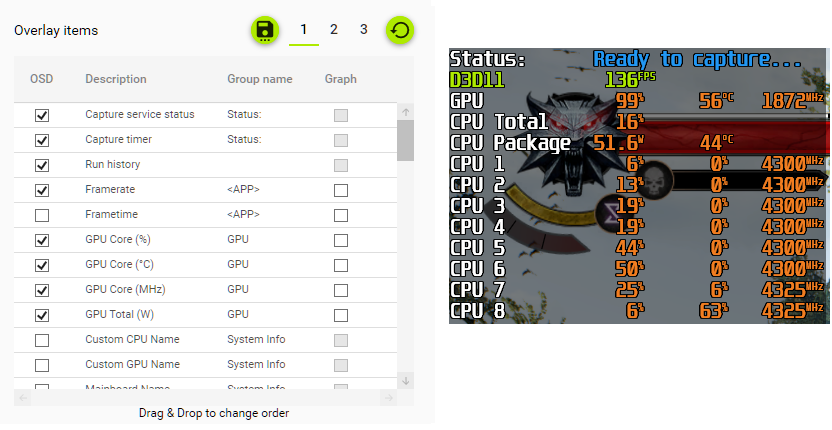
The way they get displayed on the overlay works exactly like MSI Afterburner, so you set the group name and every entry with the same group name gets displayed in the same line sorted like they are in the list.
The general order depends on the first appearance of an individual group name, for example in the image above if you'd put the "Custom CPU Name" between "GPU Core (%)" and "GPU Core (°C)" the order on the overlay wouldn't change because the first "GPU" entry is still above the first "System Info" entry.
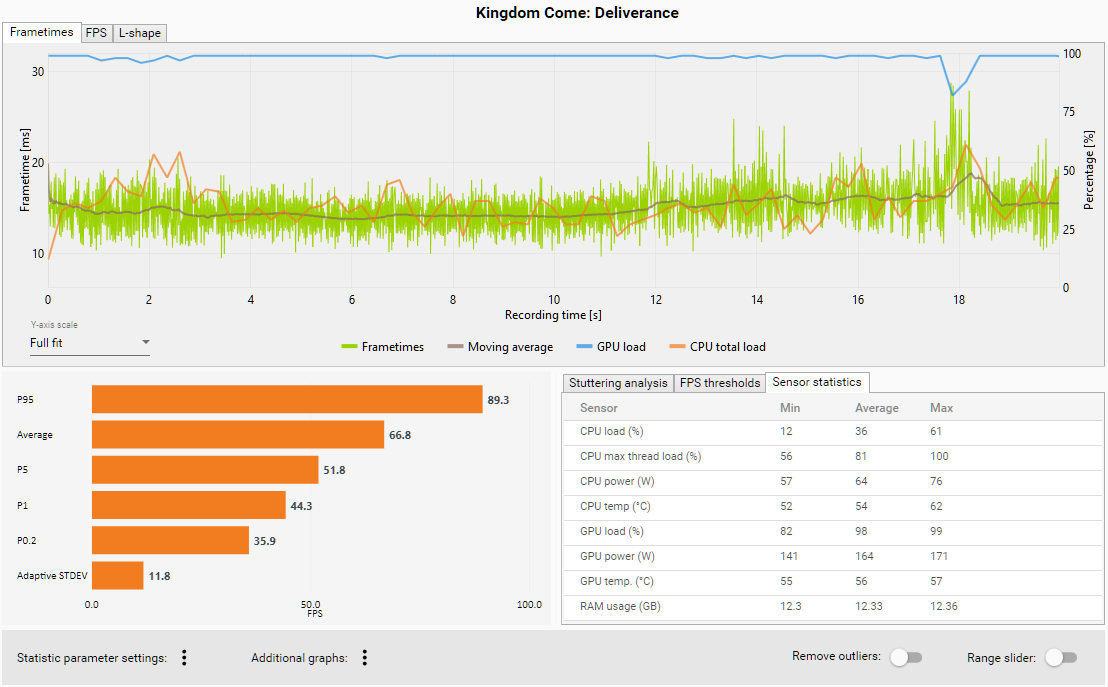
In addition to the possibility of showing all these sensors on the OSD, we also implemented a logging function together with additional options on the "Analysis" page for records containing sensor data.
You can activate the logging on the "Capture" page and set a logging interval. Now, when capturing, the data for CPU/GPU loads, power and temperature aswell as the RAM usage over the course of your benchmark run will be saved in the capture file.
When analyzing a record that contains sensor data you can add additional graphs for CPU and GPU load and have access to the new "Sensor statistics" tab which shows you the min, avg and max values of all logged sensors.
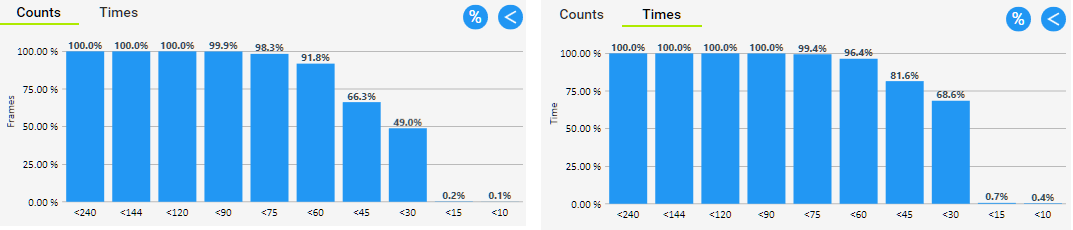
New threshold values
The last addition to version 1.5.0 is the option to switch the values on the "FPS thresholds" tab from the number of frames above or below thresholds to the time spent above or below thresholds.
While it's good to know the amount of frames above or below thresholds, the better indicator of fluid gameplay is the absolute time you were above or below those thresholds.
Here is an example how much of a difference this can make